Sunday, June 28, 2009

Know thy timeframe

Picking a chart timeframe is perhaps one of the most important trading decisions you'll make as a trader. Your personality, trading style, risk tolerance, profit targets, and many more inputs will most likely dictate what timerames you use to trade.

Timeframes are to traders what maps are to navigators. Without the right map, you are going nowhere fast. If you are driving from South Beach to West Palm Beach, you need to look at a map of Miami/Ft. Lauderdale, NOT a map of the United States. Personally (and like 99% of traders), I am blind without looking at a chart. I use technical analysis almost exclusively to make my trading decisions. If you are like me, then you spend your entire trading day looking at charts. As such, a trader needs to pick a trading timeframe that is most advantageous to their trading results.

If you are a swing trader, perhaps you use the 60 or 30 minute chart and daily/weekly for trend. If you are an investor/long term trader, then you probably use the daily chart and weekly/monthly for trend.

But if you are a day trader, there are many more options to consider. It is not an easy decision to make. A trader really needs to assess what his/her goals are each day from the market. Are you a trend follower? Do you want to make 1-2 trades a day only? Are you a scalper and comfortable making 10-20 trades a day? How much are you willing to risk on each trade? How comfortable are you holding a position for a longer period of time - i.e. how patient are you? A higher timeframe will give you a higher risk (stop level) and more reward (profit target). But you are in a trade longer than you might like. Maybe most importantly, your system may give the best results at a specific timeframe. A lot of analysis, research, trial and error, and patience are needed to find that right timeframe.

Personally, I have tried them all. 1,2, 3, 5, 10, 15 minute charts for trading and 30, 60 and daily for trends. I have even used Volume charts as well. I have to admit, that up to about a month or so ago, I have been most successful using the 15 minute chart for my trade signals. However, I felt the need to explore other options for a couple of reasons. I am married to eSignal for my trading as all my indicators are customized in the native language (EFS). But I've had a lot of issues with their data service. As most of you who read my blog and follow me on twitter may know, I am constantly frustrated with the freezing of the application during heavy volume periods. The application is not true multi-threaded and it just stops responding. This happens with time based charts and volume based charts too.

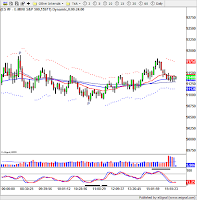
The other, and more important reason, is that with summer doldrums here, I am finding that my usually reliable system was giving more false signals than I like. Whipsaws, headfakes, false breakouts are common occurrences during low volume periods. So, I have been experimenting with Tick charts. Right now my favorite settings are a 610 and 1597 Tick charts. Below are some samples of ES from Friday June 26 - the 5 minute, 610T and 1597T charts. What I like about Tick charts, is that you are no longer constrained by periods of low volume like lunch time. The bars form as fast or as slow as the price is moving, and the chart looks 'cleaner' and more symmetrical. On the 1597 setting a bar could take 2 minutes to form or 10 minutes, depending on the action.

The setting of the chart is irrelevant - 610 and 1597 happen to be Fibonacci numbers. It could be 100 or 5000 - it really does not matter. What matters is what you as a trader feel most comfortable with. The bottom line, is that you have to find the timeframe that works best for you. If 5, 3 or 1 minute charts work, then stick with it.

The best news for me is that my eSignal application problems have disappeared with tick charts. Don't know why, and I don't care to know why. That's just fine by me.

Good luck with your trading.


Sunday, June 21, 2009

Averaging down. To do it or not to do it...

I hope everyone is having a great weekend and Father's day.

I wanted to touch on the subject of averaging down when holding a position for a couple of reasons. A friend of mine, who I consider to be an experienced trader, did this recently. And, I have touched on this subject in previous posts, but feel it deserves a topic all by itself.

Averaging down - a double edged sword. You open a stock/position, the price goes against you, and you are left with a decision: Do you stop out, or increase your position size to reduce your breakeven point and get out/make profit sooner? We have all been there and done it at one time or another in trading.

And we have all heard the arguments before (for and against): Buy more! It's a great stock and it WILL come back - the market is in an upswing. Sell it! You NEVER average down.

I am not sure there is a definite, correct answer to this question. I think it's a 'It depends' anwser. Before you say that I am hedging here, let me explain and then give my own personal opinion.

I think it depends mostly on the type of trader/investor you are, and your portfolio. If you have deep pockets and can afford to not only average down, but expand your risk AND wait for the price to come back, then that's fine. If your position is a very small part of your portfolio, and averaging down does not put the position against your risk tolerance, then maybe.

But here are the real questions one should ask before averaging down:
  • Why are you averaging down?
  • Does averaging down expose the position to more risk than your plan allows?
  • Is averaging down PART of your trading plan?
  • Do you have an EXIT strategy should the position NOT come back? (i.e hard stop, etc.). I mean, you are not going to keep averaging down are you? (Note: if you answered yes, please close this page and erase all instances of my link from your browser).
  • Most importantly, if you did NOT have a postion in this stock already, would you OPEN a postion now? Does this stock fall in the criteria of your plan if you wanted to open a new position? If you answered no, then I ask: Why are you buying (averaging down)?

I believe averaging down should only be done by experience traders who not only know what they are doing, but whose accounts are able to withstand the hit if it does not work out. And maybe, if you are investor with a very long timeframe and are willing to wait out the position.

In my opinion, traders should NOT average down. The minute you do, your focus now changes to 'Hope' that the position will come back so you can exit sooner. Hope is word that should be eliminated from a trader's vocabulary. There is a reason a position has moved away from you (usually, a pretty good one). If you like the stock that much, then wait for it to come back to your original sell point and THEN buy it. Or, even better, wait for another entry that falls within your plan. Take emotions and stress out of it (easier said than done, right?).

We've all been there before: you open a position, it moves away, stops you out, and then comes back. But this is the life of a trader. You live to fight another day. Think about all the times you got sopped out of a potentially disastrous situation.

I don't know about you, but capital preservation is much more important to me than making money. Why? Because I have a system that is reliable and will ALWAYS give me good entries to postions that make money AND fall within my trading style/plan. Losses are part of trading and unavoidable. It is much better to analyze WHY you got stopped out, and learn from a losing trade.

Above all else, and I cannot stress this strong enough, make sure you have a trading plan and are taking trades according to that plan. The minute you deviate, you'll get nailed.

Good luck with your trading.

Thursday, June 11, 2009

In trading, does practice make perfect?

It's been a while since my last post, but I have been extremely busy, as you'll soon find out.

The short answer to the question is: I don't know, but I sure hope so. Maybe not perfect, but more consistent.

I read somewhere a while ago about a former Redskins defensive football player (the name escapes me), and his thoughts about the NFL. He talked about games and practice and so on. When he first started playing, he always wondered/complained about why they practiced plays over and over and over again. It wasn't until later in his career that he fully understood why. The obvious answer is to be disciplined and get the play/scheme right. Make sure you are in the right spot, covering the right person, making the right tackle, etc. But the more important reason, is that during game speed, not only will you know instinctively how to make the play, but you will know how to REACT should the play or conditions change. You can recognize when things are not going according to plan, and with minimum thinking, adjust on the fly to make the play.

I think trading is similar to a certain degree. During trading hours, there is no timeout, no replays. You can't stop the clock to think. You have to react. This is where discipline and practice come in. There are many ways to practice in trading. The best way, especially when trying a new system, is to trade live with real money. Small money, but real nonetheless. Why? The emotions are there. Paper trading during market hours is the next best way to practice.

In my case, since I use eSignal, there are a couple of other ways to practice. I can download tick data for any symbol, and run the data in playback mode. This gives me scenarios where the chart sets up just like real time and the indicators give me the signals as necessary. Even more importantly, I can place dummy trades just like real time, and determine/refine my money management skills. It is as good as paper trading, but can be done at any time, and you can speed up the playback mode.

Personally, I have a pretty reliable system for my day trading. However it is very price sensitive, and while it works great in trending markets, I am finding that during choppy days, I get many false signals. For this reason, I have been spending a LOT of time optimizing, backtesting and practicing the tweaks/refinements to my system to the point where I feel more confident in its application under any market circumstances. Everytime I make any adjustments, I run eSignal in playback mode and take trades based on the indicators to see how well they work.

The point I am trying to make is that whatever system you use, it is necessary to backtest to make sure it gives proper and acceptable returns. Additionally, it is also important to know/practice how the system acts in real time, and even more importantly, how YOU should react if the system does not go according to plan. Backtesting gives you numbers and percentages which is good. But you actually taking the trades based on your system - now that's the key.

I will have another post soon to discuss in more detail what some of these tweaks are, and how my trading has been affected.

Learing never stops as a trader. I have been day trading for about a year, and have spent countless hours thinking over, analyzing, optimizing, you-name-it-izing my trades, system, risk/reward, etc. I have spent almost every spare hour of my time doing this. And while I will never be able to make if perfect, I should be able to become a more 'consistent' trader. THAT is my ultimate goal.

Good luck with your trading.