Sunday, June 28, 2009

Know thy timeframe

Picking a chart timeframe is perhaps one of the most important trading decisions you'll make as a trader. Your personality, trading style, risk tolerance, profit targets, and many more inputs will most likely dictate what timerames you use to trade.

Timeframes are to traders what maps are to navigators. Without the right map, you are going nowhere fast. If you are driving from South Beach to West Palm Beach, you need to look at a map of Miami/Ft. Lauderdale, NOT a map of the United States. Personally (and like 99% of traders), I am blind without looking at a chart. I use technical analysis almost exclusively to make my trading decisions. If you are like me, then you spend your entire trading day looking at charts. As such, a trader needs to pick a trading timeframe that is most advantageous to their trading results.

If you are a swing trader, perhaps you use the 60 or 30 minute chart and daily/weekly for trend. If you are an investor/long term trader, then you probably use the daily chart and weekly/monthly for trend.

But if you are a day trader, there are many more options to consider. It is not an easy decision to make. A trader really needs to assess what his/her goals are each day from the market. Are you a trend follower? Do you want to make 1-2 trades a day only? Are you a scalper and comfortable making 10-20 trades a day? How much are you willing to risk on each trade? How comfortable are you holding a position for a longer period of time - i.e. how patient are you? A higher timeframe will give you a higher risk (stop level) and more reward (profit target). But you are in a trade longer than you might like. Maybe most importantly, your system may give the best results at a specific timeframe. A lot of analysis, research, trial and error, and patience are needed to find that right timeframe.

Personally, I have tried them all. 1,2, 3, 5, 10, 15 minute charts for trading and 30, 60 and daily for trends. I have even used Volume charts as well. I have to admit, that up to about a month or so ago, I have been most successful using the 15 minute chart for my trade signals. However, I felt the need to explore other options for a couple of reasons. I am married to eSignal for my trading as all my indicators are customized in the native language (EFS). But I've had a lot of issues with their data service. As most of you who read my blog and follow me on twitter may know, I am constantly frustrated with the freezing of the application during heavy volume periods. The application is not true multi-threaded and it just stops responding. This happens with time based charts and volume based charts too.

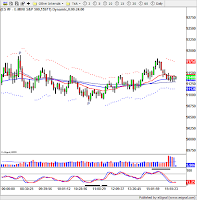
The other, and more important reason, is that with summer doldrums here, I am finding that my usually reliable system was giving more false signals than I like. Whipsaws, headfakes, false breakouts are common occurrences during low volume periods. So, I have been experimenting with Tick charts. Right now my favorite settings are a 610 and 1597 Tick charts. Below are some samples of ES from Friday June 26 - the 5 minute, 610T and 1597T charts. What I like about Tick charts, is that you are no longer constrained by periods of low volume like lunch time. The bars form as fast or as slow as the price is moving, and the chart looks 'cleaner' and more symmetrical. On the 1597 setting a bar could take 2 minutes to form or 10 minutes, depending on the action.

The setting of the chart is irrelevant - 610 and 1597 happen to be Fibonacci numbers. It could be 100 or 5000 - it really does not matter. What matters is what you as a trader feel most comfortable with. The bottom line, is that you have to find the timeframe that works best for you. If 5, 3 or 1 minute charts work, then stick with it.

The best news for me is that my eSignal application problems have disappeared with tick charts. Don't know why, and I don't care to know why. That's just fine by me.

Good luck with your trading.


Sunday, June 21, 2009

Averaging down. To do it or not to do it...

I hope everyone is having a great weekend and Father's day.

I wanted to touch on the subject of averaging down when holding a position for a couple of reasons. A friend of mine, who I consider to be an experienced trader, did this recently. And, I have touched on this subject in previous posts, but feel it deserves a topic all by itself.

Averaging down - a double edged sword. You open a stock/position, the price goes against you, and you are left with a decision: Do you stop out, or increase your position size to reduce your breakeven point and get out/make profit sooner? We have all been there and done it at one time or another in trading.

And we have all heard the arguments before (for and against): Buy more! It's a great stock and it WILL come back - the market is in an upswing. Sell it! You NEVER average down.

I am not sure there is a definite, correct answer to this question. I think it's a 'It depends' anwser. Before you say that I am hedging here, let me explain and then give my own personal opinion.

I think it depends mostly on the type of trader/investor you are, and your portfolio. If you have deep pockets and can afford to not only average down, but expand your risk AND wait for the price to come back, then that's fine. If your position is a very small part of your portfolio, and averaging down does not put the position against your risk tolerance, then maybe.

But here are the real questions one should ask before averaging down:
  • Why are you averaging down?
  • Does averaging down expose the position to more risk than your plan allows?
  • Is averaging down PART of your trading plan?
  • Do you have an EXIT strategy should the position NOT come back? (i.e hard stop, etc.). I mean, you are not going to keep averaging down are you? (Note: if you answered yes, please close this page and erase all instances of my link from your browser).
  • Most importantly, if you did NOT have a postion in this stock already, would you OPEN a postion now? Does this stock fall in the criteria of your plan if you wanted to open a new position? If you answered no, then I ask: Why are you buying (averaging down)?

I believe averaging down should only be done by experience traders who not only know what they are doing, but whose accounts are able to withstand the hit if it does not work out. And maybe, if you are investor with a very long timeframe and are willing to wait out the position.

In my opinion, traders should NOT average down. The minute you do, your focus now changes to 'Hope' that the position will come back so you can exit sooner. Hope is word that should be eliminated from a trader's vocabulary. There is a reason a position has moved away from you (usually, a pretty good one). If you like the stock that much, then wait for it to come back to your original sell point and THEN buy it. Or, even better, wait for another entry that falls within your plan. Take emotions and stress out of it (easier said than done, right?).

We've all been there before: you open a position, it moves away, stops you out, and then comes back. But this is the life of a trader. You live to fight another day. Think about all the times you got sopped out of a potentially disastrous situation.

I don't know about you, but capital preservation is much more important to me than making money. Why? Because I have a system that is reliable and will ALWAYS give me good entries to postions that make money AND fall within my trading style/plan. Losses are part of trading and unavoidable. It is much better to analyze WHY you got stopped out, and learn from a losing trade.

Above all else, and I cannot stress this strong enough, make sure you have a trading plan and are taking trades according to that plan. The minute you deviate, you'll get nailed.

Good luck with your trading.

Thursday, June 11, 2009

In trading, does practice make perfect?

It's been a while since my last post, but I have been extremely busy, as you'll soon find out.

The short answer to the question is: I don't know, but I sure hope so. Maybe not perfect, but more consistent.

I read somewhere a while ago about a former Redskins defensive football player (the name escapes me), and his thoughts about the NFL. He talked about games and practice and so on. When he first started playing, he always wondered/complained about why they practiced plays over and over and over again. It wasn't until later in his career that he fully understood why. The obvious answer is to be disciplined and get the play/scheme right. Make sure you are in the right spot, covering the right person, making the right tackle, etc. But the more important reason, is that during game speed, not only will you know instinctively how to make the play, but you will know how to REACT should the play or conditions change. You can recognize when things are not going according to plan, and with minimum thinking, adjust on the fly to make the play.

I think trading is similar to a certain degree. During trading hours, there is no timeout, no replays. You can't stop the clock to think. You have to react. This is where discipline and practice come in. There are many ways to practice in trading. The best way, especially when trying a new system, is to trade live with real money. Small money, but real nonetheless. Why? The emotions are there. Paper trading during market hours is the next best way to practice.

In my case, since I use eSignal, there are a couple of other ways to practice. I can download tick data for any symbol, and run the data in playback mode. This gives me scenarios where the chart sets up just like real time and the indicators give me the signals as necessary. Even more importantly, I can place dummy trades just like real time, and determine/refine my money management skills. It is as good as paper trading, but can be done at any time, and you can speed up the playback mode.

Personally, I have a pretty reliable system for my day trading. However it is very price sensitive, and while it works great in trending markets, I am finding that during choppy days, I get many false signals. For this reason, I have been spending a LOT of time optimizing, backtesting and practicing the tweaks/refinements to my system to the point where I feel more confident in its application under any market circumstances. Everytime I make any adjustments, I run eSignal in playback mode and take trades based on the indicators to see how well they work.

The point I am trying to make is that whatever system you use, it is necessary to backtest to make sure it gives proper and acceptable returns. Additionally, it is also important to know/practice how the system acts in real time, and even more importantly, how YOU should react if the system does not go according to plan. Backtesting gives you numbers and percentages which is good. But you actually taking the trades based on your system - now that's the key.

I will have another post soon to discuss in more detail what some of these tweaks are, and how my trading has been affected.

Learing never stops as a trader. I have been day trading for about a year, and have spent countless hours thinking over, analyzing, optimizing, you-name-it-izing my trades, system, risk/reward, etc. I have spent almost every spare hour of my time doing this. And while I will never be able to make if perfect, I should be able to become a more 'consistent' trader. THAT is my ultimate goal.

Good luck with your trading.

Wednesday, May 20, 2009

Possible Double Top

It was a very interesting day today. What started out as another gap up and continuation certainly did not end that way. The buyers were very eager this morning as Geithner was answering questions about the economy to a congressional committee.

In what can only be described as 'panic buying', the indices marched straight up right from the open with very little breathing room. You either had to chase or be left behind. The ES emini futures topped out at around 923 - right at last week's highs and filled the gap from last Monday 5/11.

That's when the sellers stepped in. The selling was intense and accelerated in late afternoon. ES ended the day right at 900, while the Dow Jones retreated all the way from around 8600 to close at 8422. The daily chart of the SPY shows that we are in a very congested area, with a tightening triangle forming, along with a possible double top. The 'glass half full' argument would debate that we may be forming a Cup with handle that will be triggered with a push above today's highs on volume. There is a valid argument to be made for either case, but the fact remains that until this area gets resolved one way or another, it is going to be very choppy. The weekly chart is still overbought and the stochastics have crossed, but the sell signal will only be triggered if we take out last week's lows.

The next few days will be key again for the market. There are support and resistance levels galore, and one of these levels will have to be taken out. Although I am leaning for a correction, I am prepared for either scenario. Ags are looking mighty ripe for a correction, as are energy, solars and coals. Gold and oil look good for a continuation.

Stay alert and good luck with your trading. I'll see you on twitter.

Sunday, May 17, 2009

Bear in bull's clothing, or more bear stew?

The pullback week that we have all be waiting and yearning for is finally here. After a historic monster of a rally, stocks took a much needed breather last week with the indices down between 3-5%. However, some sectors took bigger hits, e.g. XLF, IYR, XLE and XME were down between 6-11%. I think it is safe to assume that the 'character' of this rally will be tested in the coming week, if not the next few days. Is it a bear in bull's clothing, or is the bull setting up a trap for more bear stew?

This move sets up a much important test for the market. Many stocks are at 'logical' pullback buy points - whether you are looking at stochastics, CCI, MACD, etc. or simple pullback chart patterns. Additionally, many stocks are resting at the 20 or 50 MA on daily charts. Declining 200MA resistance still sits comfortably above the majority of stocks and the indices. Usually, the first test of this resistance fails, and the second test on strong volume is a good indication of a recovery in the chart pattern.

Although the daily charts do look very promising technically, the corresponding weekly charts are pointing to an even more significant pullback if the lows of last week are taken out convincingly. The SPY weekly is setup perfectly for a stochastic sell signal on the weekly chart and has historically been a very accurate indicator if/when triggered. Obviously, this does not mean the same thing will happen. It is very possible we may not even retest or breach the lows of last week. Also remember, that there are now 'trapped' longs who jumped in late on this rally and will be anxious to 'break even' the longer we do not get back up to the highs (more fuel to the selling fire).

Additionally, my TA system is showing a strengthening of the US Dollar vs. Euro and GBP, which could adversely affect commodities and oil - meaning a more severe pullback might be in store. Furthermore, MOO closed with a 'doji' on Friday with above average volume. Ags have been unstoppable the last few weeks and are due for a pullback, especially with the 200MA in close proximity as resistance.

In conclusion, I think it is safe to assume that this is becoming more and more a stock picker's market. Focus on the strong stocks in strong sectors for long positions (i.e. the leaders), and short the weak stocks in the weaker sectors. There is no shortage of watchlists for both longs and shorts in this market, so be prepared for both scenarios and look to book profits when you have them.

The burden of proof now lies squarely on the shoulders of the bulls. Is the worst over? Will more banks fail? Is unemployment going to hit 15%? I don't think ANYONE really knows the answers to all these questions. The market will let us know in due time. No need to guess or force our opinion on anyone, including the market. Prices are THE best leading indicator - follow the market for your cues, and stick to your trading plan.

I hope everyone had a great weekend and is ready to make some profits this week. Good luck and I'll see you on Twitter.

Wednesday, May 13, 2009

Assessing the damage

Well - it sure wasn't pretty! Actually, the adjective that comes to mind is: Ugly. That's right, it was downright ugly today. If one were to pick up a newspaper (like anyone ever does these days), or go to Yahoo and see that the indexes were down around 2-3% they'd probably think 'Ok, not too bad'.

But the real damage was 'under the hood'. Yikes. In fact that there was carnage out there. Steels down about 10%, solars -9%, energy -9%, real estate -8% - you get the picture, and don't even ask about casinos. The momentum stocks got crushed today with losses of 10% and more. Decliners outnumbered advancers by about 9 to 1. The bulls could not even muster the usual late day rally attempt.

When analyzing charts, especially for SPY (or ES), I like to look at multiple timeframes to get a feel for the short and long term trends. The weekly is setting up as a stochastic sell which has not triggered yet. A move below last weeks lows and I believe we are in for more correction. The hourly chart is looking precarious - trend lines that extend all the way back to Mar 10 have been broken for all majos indexes, and the 20MA is about to cross below the 50MA. This was attempted several times in the last several weeks, only to be reveresed rather quickly with a resumption of the rally.

It is obvious, and quite healthy, that a pullback was needed in this market. Many people (myself included) who don't like to chase have been calling for some consolidation, and an opportunity to get on-board. This is the bulls chance to show the rally is for real. The daily chart still looks intact and bullish - we are still above the 20 and 50 day MAs. There is some strong support in SPY around the 87 area - if that gets taken out easily, then the next area of support is around 83-84.

Fundamentally, it became rather obvious with today's retail numbers that the consumer is still ailing and the economy may not be rebounding as others would like to think. Unemployment is still rising, and the treasury bond yields are rising as well. The bulls have a lot to overcome here.

Regardless of what happens, there should be some fantastic opportunities to profit in this market - long or short. Remember to stick to your plan and take profits when you can.

Good luck with your trading.

Sunday, May 10, 2009

Some support and resistance levels to watch for


I watched some absolutely phenomenal analysis this weekend by great traders like @tickerville and @HamzeiAnalytics. Traders I would not have known or met without Twitter.
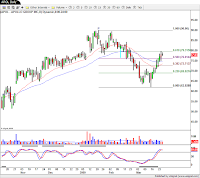
In addition to the great analysis already done, I wanted to get some charts out on SPY, QQQQ and VIX to show where some of the support and resistance areas might be and perhaps watch for signs for reversal or continuation. The first thing to notice on SPY and QQQQ is the fibonacci retracement from the pivot high to the low. We are sitting right at the 38% retracement level. Does this mean it's time to short? Absolutely not. We just need to watch this level to give us some guideline on the next move. Also notice the proximity of the 200MA to this level in both ETFs.
The other level of support/resistance is called MOB (Make-or-break) which is an eSignal proprietery indicator. Notice historically how the price either bounces off this level, or continues in the same direction after going through. It is an important tool in my analysis as it acts as a 'magnet' for prices and in most cases the price will often test this level.
For SPY we are at that level (MOB and 38% Fib Retr), with possible continuation to the 99-100 level and then pretty strong resistance around 106-107. A slight correction would take the SPY to around 81-83 level, a more severe correction to around 75, and a really severe correction takes us back to the lows.
Similarly, QQQQ has tested the MOB on a couple of occassions, has gone through the existing MOB level, and next areas of resistance are around 36, and very strong resistance at 38. A slight correction will take the QQQQ back to around 31-32 level.
The VIX is currently sitting at an important MOB level and I am 'expecting' a bouce here in the coming week. The next areas of resistance are around 40, then around 50 and 56-57. The thicker the MOB on the chart, the more powerful that level of support/resistance is.
Please remember these are just points of reference and NOT meant to be hard targets. Historically, prices gravitate towards these points, but not always. A reversal at a point just means there is a good chance for a trend reversal. A continuation through the levels means just that - trend continuation.
One thing for sure though, I believe the market is setting up for a buy on pullback. Additionally, any shorting of stocks should happen on weak stocks in weak sectors. For now, I'd stay away from shorting the leaders, such as financials.
Just some additional things to think about on a lazy Sunday afternoon. :-)

Quicksand...

Happy mother's day and I hope everyone is having a great weekend.

I was reflecting on my one year anniversay of being a day trader, and I went over my records and journals to see what mistakes I have made and the glaring weaknesses in my trading. It is interesting to see the evolution of my trading during that time. I must admit, I have adapted and tried many different styles and strategies. Some were good, some were bad. Overall though, I feel I have settled pretty well on my strategies and style for day trading as a means of making a living. It is also interesting to see that most of my losses were mistakes made by ME, and I had no one to blame but myself.

In going over my journals, I noticed a few times where I made one common mistake. The last time this happened was in October last year where I lost 15 times more than what I had originally lost in that day. Becasuse I was trying to recover my initial profits and eventual slight losses. It was probably the wildest trading day of the year (maybe ever) where the VIX spiked to almost $90. Remember that day? I sure do. I'll never forget it. I was lucky enough to recover from that day - but it taught me several extremely valuable lessons. I always fear making this mistake and I believe I am overcoming that emotion.

If you've watched the movie The Replacements with Gene Hackman and Keanu Reeves, you'll know what Quicksand means in reference to football. The coach (Hackman) asks the team: what is your greatest fear? The QB (Reeves) replies: Quicksand. Things are going well for you, then you start making mistakes. All of a sudden it's a downward spiral and you cannot control the sinking - like you're in a quicksand. The Detroit Lions are very familiar with this concept - clutching defeat from the jaws of victory.

But seriously, I think the same concept applies to trading and has happened to me on a couple of occassions. You are making a profit. Then a couple of quick losing trades and you are now down. You want to 'make up' your losses and your emotions and fear rule over logic. You are now trading recklessly and pretty soon you are down a lot more than what you were trying to recover - Quicksand. Overtrading.

It took me some time, but I was able to overcome this by putting a limit on myself. If I make 3 losing trades in a row OR I lose 2% in one day - I am out for that day. I stop trading, regardless of how 'good' setups are. It is important to understand that there are opportunities to make money every day in the market. Wealth is accumulated over a period of time and many trades, not in ONE trade.

As you look for opportunities to go long or short in this market, make sure that you are following you trading plan and set rules for yourself on risk, profit, losses, etc. It's the only way to ensure consistency and survival in this business.

Good luck.

Friday, May 8, 2009

What's my stress?

So, finally, the stress test results are out. Surprised? Shocked? Stunned? No.

Do you feel it was a scam? The banks will fail? Or do you feel that we are out of the woods and 'green shoots' everywhere?

Ok, here is my opinion - I DON'T CARE! Sorry, don't mean to shout. But these are things that I have absolutely NO control over. And to me, it's all noise. So, why should I be worried about what the government thinks about the banks. Even if ALL banks failed the test - it has been demonstrated that money can and WILL be printed to 'let no bank fail'.

The only thing I concern myself with is PRICE ACTION. I react to the market. Let's face it, I am not one of those traders who 'positions' in front of news and anticipates reaction to news. A) It's not my style, B) I don't have deep pockets, and C) I don't have the analysis and experience necessary to do that. In any event, by the time you see it and position yourself, the BIG BOYS are already ahead of you.

So, what's my stress? Not seeing my price patterns for trading and not getting any buy/sell signals from my indicators. That's it. I am only worried about watching the action unfold and recognizing price patterns that fit my strategy and trading plan. Once I see it, I will trade it. My focus over that last 9 months has been and will continue to be, intra-day price action. I am not interested in holding anything overnight for now. I absolutely love this rally, and when I see good setups, I feel confident that I will start swing trading again. We need to let the dust settle and let the market prove to us that we are out of the woods, not hear it from some CNBC analyst.

The job numbers are out and futures have retraced a bit. I am still 'expecting' a minor correction - but who knows with this market, one day may be all we get for now.

Good luck in your trading and I'll see you on Twitter.

Tuesday, May 5, 2009

Will BAC be the catalyst for a correction?

A story is breaking this evening at the Wall St Journal regarding BAC needing an additional $34B in capital to survive. This news has caused the futures to dip quite a bit. So, I wanted to take this opportunity to post an update of my thoughts on the overbought indicators I am seeing on the SPY.

I read a post earlier by Keith Shepard (@keithshepard) where he talks about the NYSE Bullish Percent Index approaching overbought levels, and how it might be time to be defensive. On the SPY chart, I have included the traditional Stochastic and RSI indicators on a weekly chart. The stochastic is setting up as a high percentage low risk sell, but is yet to be triggered. 1 or 2 down weeks will trigger this signal and the market should go through some correction - how much is yet to be determined. My initial target would be around 80-81 for a minor correction, and around 60-63 for a more severe retracement. The RSI indicator is also overbought at these levels and one can see the historical response to these levels on the chart. Declining volume over the last few weeks is also of some concern.

The question we have to ask is: will BAC or stress tests results or any bad news for that matter, produce enough of a catalyst to induce a round of profit taking. If so, then the next dilemma becomes do we buy the pullback or watch this market sink to new lows? One step at a time. Let's get a pullback first and then we can react to the market as it unfolds.

I personally think a pullback is going to provide some fantastic opportunities for longs in leading sectors.

In the words of the always real @tickerville: Let's keep it real.

Good luck.

Sunday, May 3, 2009

False breakouts? Or something else

I hope everyone had a great weekend and is ready to get back to work next week.

This market just refuses to give anything back. Every little intra-day dip is being bought without any fear. A little too complacent in my opinion. Volume has just been not very impressive the last few weeks. However, volume or not, the points are racking up on the SPX and DOW and we continue to march upwards. There are still heavy resistance levels overhead and this week's news should provide some direction. April unemployment data is coming out, and it will have to be absolutely disastrous numbers to even make a dent in this market. The bigger news is the stress test results. The fact that the release of the results was postponed on Monday is not a very good sign - but that's just my opinion.

Looking through charts over the weekend, I could not help but notice a divergence in chart patterns. No longer do all charts look the same as has been the case for the last, oh I don't know eight/nine months. Many stocks are breaking out either from a cup and handle, or forming the right side of a cup. Last Friday, many energy, commodities, ags and steel names ripped higher on strong volume. I'll definitely be keeping an eye on these sectors for longs the coming weeks. The only problem I have with breakouts at this stage of this rally, is that we have come too far too fast and personally, I will not be chasing this strength. Mistake? Maybe, but I'd rather miss out here and let these stocks consolidate until I find my setups.

On the other end of the spectrum, bios are looking very precarious and teetering on the edge of collapse. Almost every bio stock retreated noticeably on Friday on heavy volume setting that sector up for continued weakness. Many housing, financial and real estate stocks are setting up for short opportunities this week as well. I believe some of the regional banks may be in trouble, and all you have to do is look at some charts of the weaker banks to see how they are setting up for more downside, e.g. ZION, RF, STI. Watch this sector very closely for short opportunities.

It is clear though that the leaders are emerging and setting up for continued strength as/if we move out of this bear market. At the same time, there will be lots of weak companies that will setup very nicely for short opportunities.

Stay vigilant and take profits while you can. This is one tough market to figure out. Good luck next week.

Wednesday, April 29, 2009

Fed - Running out of Ammo?

It was another very interesting FOMC day today. Futures were up on the GDP numbers - the markets opened up big and never looked back. Of course, like most people, I was looking to short the opening gap, but really did not find any opportunity. I tried once and quickly gave up as the buyers were out in full force this morning. So, instead of buying, I stepped aside. We later chopped around for a while until the Fed decision came out - then things got interesting.

There was really nothing new in the FOMC statement. The rate (target) remained the same, they are buying more (lot more) distressed assets, and a comment was made regarding the 'softening of the contraction' - whatever that means. Whatever. There was a period of indecisiveness after the release, and eventually a new wave of buying drove the indexes to the January highs. This prompted some profit taking and then a selloff during the last hour of trading, but not enough to prevent some solid gains and breakouts today.

My feeling is that the FOMC really has nothing else they can do at this point to stimulate the market, and are running out of bullets. They certainly are not going to raise interest rates, and are already pouring trillions into the market and the financial institutions. But that's just my observation.

The markets are at an interesting point here. The weekly chart of the SPY is setting up as a classic stochastic sell, and there are some stiff overhead resistance levels coming up - 20MA on Weekly for SPY and 200MA Daily for QQQQ. So, it would appear a logical place for a pullback (that's longer than 2 days). But this market has been anything but logical these days.

It'll be interesting to see how the pullback (once it gets here) is handled by the bulls. I am expecting a pullback to support and then an advance to retest the current resistance levels. And I am beginning to view this market as a 'Stock Pickers' market. You can begin to see the leaders emerge and breakout, and the pretenders languish and churn sideways and even go lower.

We'll see how things develops, and like I always say, the market leads and we dance.

Good luck with your trading.

Sunday, April 26, 2009

ST - My (new) eyes to the market

I was actually hesitant to write this post for fear of being labeled a StockTwits Slappie now. I was asked recently 'I thought you quit ST' - I'll answer that question more specifically a bit later.

ST has quickly become an integral part of my trading routine. Whether it is during the day, at night, or over a lazy Sunday afternoon. I would argue that ST afterhours is absolutely jam-packed with information that can help you prepare for the next trading day/week. From tickerville's insightful videos, to daytrend's stocks that are trending up/down, and chartsandcoffee's excellent market commentary. So, I ask, what kind of an idiot would give up that kind of information?

During the trading day, ST is part of my arsenal for reading and 'feeling' the market - my new 'eyes' to the market. Just by looking at what others are discussing, trading, and 'feeling' helps me significantly assess the overall market. Mind you it does NOT SHAPE my assessment, it HELPS me in my assessment. There's a big difference, because I still rely on my TA, my interpretation of news and market internals to make my assessments and trading decisions.

When I first started using ST, it was actually a little difficult to use. I could not monitor EVERY single tweet that came in, while effectively keeping my eyes on the market for trades. Eventually, when I narrowed down the people I wanted to follow, I just concentrated on their tweets for the most part. During the lull periods, I go back and look for other tweets and try to discover some new 'gems' to follow. And make no mistake, there are some real gems out there - both discovered and undiscovered.

ST reinforced a couple of things about myself. Not only did my trading improve, but my discipline as well. Mostly, I find that my comments and tweets are really things that I am saying to myself, but also sharing it with literally thousands of people. Additionally, there is acually a sense of responsibility with making calls to buy and/or sell on Twitter. Especially when you have many people following and perhaps, just perhaps one took your call followed you on the trade. Tha't why I would also recommend my earlier post about how to take trades based on other followers.

The bottom line is that there are thousands of people on Twitter, with blogs, information, analysis, commentary, etc. that are MUCH more experienced and qualified than myself to discuss topics and issues related to the market and make stock picks. It will takes years for me to even be in the same league as some of these traders. So, I will continue to share my thoughts to whoever would like to listen, but more importantly, I will continue to learn and absorb what these traders are telling me.

Now to answer that question from earlier, what can I say? To quote Daffy Duck: I may be a little duck, but I am a greeeeedy little duck. In my case, I may be a hot-head, but I am a greeeedy (and occassionally nice) hot-head :-) I admit it, ST has made me a better trader. In the end that's what it's all about, isnt' it?

Good luck with your trading and I hope to see you on Twitter.

Thursday, April 23, 2009

So, what's your bread and butter.

If you are a sports fan, you probably know how some pitchers have their 'pitch' - a slider, fast ball, whatever. Something they know they are extremely good at, and they can always come back to it and get batters out on a regular basis. Same concept in football - a team has a few 'signature' plays (except for the Detroit Lions of course) that they can use during a game, like a screen, a sweep, etc. It's their 'bread and butter'.

Trading is no different. Every trader should have a few 'signature' trades (at least one) that they can use at least once a day (for day traders). These can be something as sophisticated as MA Xovers, RSI/Stoch signals, or as simple as support/resistance plays. You know you can always count on making a living with these trades. You've studied, analyzed, backtested, tweaked, re-analyzed them until they gave you an excellent winning percentage. You use these on a regular basis and feel extremely confident taking these trades. These are YOUR bread and butter.

Jason Raznick was mentioning on StockTwits earlier today about how he learned over this last week to take fewer trades and only trade the ones that he had 'superior confidence' in. In other words, his bread and butter. Upsidetrader has his 5/20 trade, which I am sure is one of many - although I do not know what that particular trade is. So does alphatrends, Fari Hamzei, and many other great traders on StockTwits. The point is: find YOUR 'bread and butter'. Become REALLY good at it and use it over and over. You will notice something very interesting as well - you will start to hone in on the 'intuition' part of trading and find yourself anticipating signals and trades. This comes with practice, repetition, constant learning, hard work, and years of experience.

Today I took some nice gains from my 'bread and butter' basket. I was able to go long SDS several times today for 50c and $1 scalps. There were quite a few earnings releases after hours, including MSFT, AMZN, NFLX, SPWRA among others. Tomorrow should shape up to be another very interesting day.

Good luck with your trading.

Wednesday, April 22, 2009

Things I learned today. Market overview Apr 22

It was another roller coaster ride today. We had a gap down that was very quickly reversed and we pretty much marched back up into positive territory most of the day. This is the kind of thing that used to happen in a bear market, but in reverse. Remember all those gap ups that were quickly sold into and the bulls got crushed everytime they tried to put up a fight? Well same scenario here - except the bears are getting skinned. Literally.

But it was a very choppy day with lots of momentum changes. By my last count I think we had about 10 reversals on a 5 minute chart. But the bears finally showed up and took control of the final hour. Something they have not done in a long time. Good earnings continue to be sold in this market and one can feel the nervousness and lack of direction right now. AAPL's earnings came out and they beat convincingly, as did EBAY. Both stocks were up after hours. We'll see how traders react in the morning.

So, things I learned today. Let's make a list:
  • Stocktwits is a phenomenal resource for some extremely sharp and talented traders. Some traders anticipated the turn and expressed their 'gut' feeling long before it happened. And you can use ST as a LEADING indicator for the market. Just follow some of these smart traders, watch their tweets and their trading calls, and you'll see for yourself.
  • Never, ever go against an accurate, successful strategy/system that you follow in your trading. Today, I took my gut feeling and went against my signal. I was lucky that my trade was a low risk position and I was quickly able to reverse and go with my signal. In other words, never be afraid to bail out on a position and go in the opposite direction if it makes sense to do so.
  • Always give your trades enough room. Be patient and let the trade develop. I bailed out on a trade for a small gain, only to see it take off and missed out on a BIG gain. Definitely, this is the weakest part of my game and needs improvement.
  • It takes experience, knowledge and hard work to become a 'smart' trader and harness that 'intuition', 'it' thing that come to great traders. It is possible.
  • The folks at eSignal support are very nice and friendly bunch. After communicating with them the last few days, someone called me today. He was polite and informed me that they found a bug in eSignal that was causing the 'hanging' of the application. He tried to see if he could do anything to improve by running a remote session on my PC, but to no avail. I will just have to wait for the beta version when it comes out.

I took several scalps of SDS today and a short of POT that was good for 50 and 65c scalps. Overall, it was a very good day, but could have been better. No complaints here.

Hope this helps. Happy trading and good luck.

Tuesday, April 21, 2009

Gap Down Reversal - Worst possible scenario. Market overview Apr 21

It was an impressive day for the bulls. Their appetite for buying was relentless all day today. Futures were down big and lots of people were shorting in the premarket. The smart traders were actually buying in the premarket. The result, we reversed the opening gap down in a big way and on big volume. Although we drifted back down after 10:00AM, Tim Geithner's remarks about the banks brought the buyers back out in force and we went up pretty much all day.

Here is my theory about what happened. Yesterday's huge down day set up some fantanstic short opportunities in the market. These would be triggered on a move below yesterday's lows. Since we gapped down, everyone was scrambling and chasing to short the early weakness. The 'smart' traders who shorted yesterday starting covering. With the headline news regarding the banks coming out, more short covering. Buying begets buying, and the shorts were running for cover all day. The IDEAL situation would have been a gap UP followed by a reversal. This would have crushed the hopes of the bulls in my opinion. Now you have emboldened bulls who feel that the market will never go down. This will only make the fall that much harder I believe. It would be much healthier for the market in the long run if we can digest/consolidate this massive rally, and pullback just enough to let the bulls who 'missed' the rally get on-board.

It is what it is, and we have to adapt and trade accordingly.

My trades today were a long in GS, and a few scalps of SDS (long and short) based on my signals and moves from support/resistance. My missed trades of the day was once again a trade (short) in SKF late in the afternoon which I did not take, and a move in GBPUSD which I highlighted on Twitter before market opened, and was good for about 150pips move.

I honestly don't know what to expect - I still feel we should be consolidating for a few more days, but it is very possible we move in a range for a while until the stress tests results come out. It feels like a random market with irrational moves. But this is what makes it a market. If it were easy, we'd all be rich.

I will continue to trade in an intraday scalping mode for now.

Good luck in your trading.

I admit it - I AM A USER!

Yes, you read that right. I will use any stock, ETF, information on a stock, analysis and information of a stock by anyone, for my own financial benefit and gain. And I will use all the power necessary (legally :-) and within my means) to gain an advantage to know when to buy and when to sell a stock.

Bet that caught your attention. The point of this post is that stocks are meant to be used when the time is right. Do not get emotionally attached to a stock or ETF or even a conviction of market direction. Just because you 'think' or 'believe' a stock or sector should go up or down does not mean that it will. The market can be an emotional, irrational beast and will go where it WANTS to go. Not where we want it to go.

Notice how the good traders are always using stock price movement and market sentiment to their advantage? Go to StockTwits, and observe some of the excellent traders there. Notice how they don't let their emotions dictate their trading. They are swift, nimble AND quick to drop a trade when they feel it is not working, and have NO problem going in the opposite direction if that's where the action is. Don't let your conviction and emotions get in the way of your trading success.

Remember, trading is about making money and taking profits. The market gives you nothing but an opportunity. USE that opportunity wisely. It is a jungle out there and everyone wants YOUR money - no one cares about you. Not if you can do something about it.

I will say it again, above all else, make sure you have a trading plan, a strategy (or several) and a money management plan that protects your profits and limits your losses.

Good luck with your trading.

Monday, April 20, 2009

Relax - It's Just One Day (so far)...

It was a sea of red today. With the exception of GLD, all major sectors were down. BIG. The catalyst? Some rumor about the stress tests results, and the BAC earnings report - something about a surge of bad loans. What? You're kidding, right? So, all this euphoria over the last six weeks and the 'record' earnings in some banks was just smoke? Hmmm...

In my post yesterday, I mentioned that if history repeats itself, we are due for a correction. Well, part 1 of that correction occurred today. Now the question becomes, is this part of a slight pullback in the new 'bull' market, or continuation of the bear market? That's why the title of this post is'It's just one day'. The market was waaaaay overbought and needed an excuse to go down. Technically, the daily chart of the SPY is not broken yet. We are still above the 20 and 50MAs, and the 20 is still above the 50. However, on the 60 minute chart, we look vulnerable for more downside. The next levels of support seem to be around 81.50 and then around 78. Make no mistake, today was a big drop, bringing us that much closer to the next levels of support. If those do not hold, then there is much more downside to go.

My trades today were GS which was scalped for a short twice, and I took shorts in ADM (highlighted by tickerville on Saturday), and NIHD which I mentioned on Twitter yesterday. I was able to scalp about 60c to $1 on those trades. The best trade of the day which I DID NOT take was a signal to go long SKF at around 12:30 which would have been good for 3-4 points. Ah well, you can't take 'em all - it was a good day regardless.

I see some more downside this week, but the burden is now on the bulls to resume the uptrend by buying the pullbacks. Oil looks terrible and I will be looking there (ERY) for shorts this week.

Good luck.

Sunday, April 19, 2009

Where's the volume?? Market overview for April 17

Ok. We have all heard the same story over and over for a few weeks now. This is a bear market rally. We should turn any day now. We are going down big. No jobs, bad housing market, commercial RE tanking, toxic assets, etc. etc. etc.

I will leave the discussions about the economy to the so-called experts. I have my charts to guide me and my trading account. This is what the chart of the S&P is telling me. It does NOT care what I or anyone else thinks. It will go where it will go. Period. All we can do is try to read the tea leaves and ride the wave.

So, looking at the daily of the SPY, one question comes to mind: Does history repeat itself? It usually does (notice the 'usually' here). I am not hedging, but my analysis only gives me history to look at to try to determine the future (occasionally, my analysis is wrong). History tells me that during periods of low volume gains in the SPY, especially recently, followed by a reversal candle, the market usually goes through a correction phase. I anticipating a reversal in the coming week - how severe is yet to be determined. Ideally, I'd like to see the SPY challenge its 50MA and either make a clean break below, or bounce and continue its upward move. Either way, I'll be ready to take advantage of any opportunities - long or short.

On Friday, I took a couple of low risk entries for reversal from resistance areas for the ES/SPY. The first one was stopped out for 20c loss, and the second one a 10c loss. I completely ignored my one good signal from my TA system to go long SPY at 11:30 which would have caught most of that nice reversal move. I just don't feel comfortable going long right now - but with an 80% win rate on my signals, I really should pay more attention to it.

We'll see what BAC does tomorrow pre-market. Should be a very interesting week indeed.

Good luck with your trading.

Why Traders should have a (VERY) short-term memory

When I first started day trading, one of the things that really affected my performance (negatively), was the fear of the same thing happening again if I were to take another trade. Especially, if I took the same setup once or twice and the same result happened - I get stopped out for a loss.

A day trader's profession is similar to a closer in baseball, or a goalie in hockey. You GOTTA shake off that last pitch or goal or game (whatever) and try again. Otherwise, you'll miss the good setups when they do present themselves. Now, this does not mean to 'Overtrade' just because you took a couple of losses. It means one must stick to their trading plan and have the confidence that the odds are in their favor. This is done through hard work, backtesting, learning, and using sound money management to ensure you live to fight (trade) another day.

And just like pitchers and goalies, a good trader needs to adapt and recognize when thier 'game' is off. Being nimble and aware of changing market conditions allows you to take advantage of the opportunities while anticipating when NOT to get in a trade.

You are not alone in this, and the wheel certainly does not need to be re-invented. StockTwits is a great wealth of knowledge and information that can be used very effectively for analysis, opinions, etc. Some of the advice given by tweeters such as tickerville, alphatrends, steenbarb are priceless. Use this information along with YOUR analysis to help guide you through your trading and investment decisions.

Occasionally, the best thing a trader can do who's on a losing streak is to step away for while - take some time off to re-energize, unwind and come back to trading with a fresh mindset.

Remember, sometimes NOT trading is the BEST trade.

Good luck and I'll see you on Twitter.

Friday, April 17, 2009

My opinion on how to trade using StockTwits followers

I got the idea for this post after watching twitterers on StockTwits take some trades based on the people they follow. Overall, there have been some GREAT calls made, but let's face it - no one is perfect. Yes, not even me ;-)

But I was amazed to see some people take trades based on a call made by a famous bottom=caller, who shall remain nameless, and then they started to tweet him things like: what's your stop on this, or what stocks are you short, etc. This prediction to short a certain sector was made in the morning. And as I type this post, the sector ETF is down about 5% from the open. I am sure this person (who has an EXCELLENT record BTW) has closed his position and gone the opposite direction, or stayed in cash.

My advice is this: if you are taking a trade based on someone you follow (including myself), please, please make sure it falls within YOUR strategy, trading plan, risk tolerance, etc. And even more importantly, use YOUR money management plan on the trade should it go against you. At the end of the day, this is your trading account and you are accountable to yourself and NOT the person you follow. In my case I am accountable to my beautiful wife.

So, please consider wisely whether or not you are comfortable with taking a trade based on StockTwits and above all, make sure it falls within your trading plan.

Good luck and have a great weekend.

Thursday, April 16, 2009

Too late to Long, too early to Short? And Market overview for April 16

Another earnings release that beat estimates, this time JPM, early in the morning was setting up a 'sell the news' reaction. JPM actually traded down for a while but then quickly recovered to end the day positive. Unemployment claims number came in better than expected, however, the more important number in my opinion - the CONTINUING claims was at a record high. A record HIGH. Not sure how the economy is going to recover with so many people out of work.

Anyway, we started the day down, chopped around for a bit and then around 2:00pm the market marched straight up and we closed near the highs of the day. I took two trades: a long in SDS when the ES/SPY bounced from its VWAP at around 10:30am, and a short in SDS when the ES/SPY bounced from the daily pivot point around 11:00am. Both trades were scalped for 50c/60c and 35c. I closed my second trade quickly as I thought we were hitting resistance on ES, and going into lunch hour I felt we might drift lower. Boy was I wrong! The market just kept going higher and higher. This is an area of weakness for me and I definitely need to improve on letting winning trades run. Unfortunately, I had to run some errands and I missed a great signal to long the market again at around 2:15pm.

So, where are we now. It seems like we have been saying this for a while. It's too late to go long, yet it's too early to go short. So, what's one to do? Well, it depends on your style and trading plan. If you don't like to chase prices, then going long here might be risky. If you like to buy on a pullback, then you are still waiting because a pullback has not happened. If you are itching to short, I think you already know that it can be dangerous to your health. If you are a day trader, then it should NOT matter because your focus is what trend is developing DURING the day.

The only advice I can offer is to stay patient. Do not force a trade if it is not there and stick to your plan and rules of engagement. Let the trade come to you (or jump out at you when you see it). There is no need to force things, or try to catch a top, just like all those who got burned trying to catch a bottom just a month and half ago. We need the market to digest these gains and consolidate to see if we REALLY have hit a bottom. The only way is for a pullback and then a move back above to challenge and reclaim the 200MA.

Tomorrow we have C and GE announcing earnings and should provide some fireworks, along with options expirations Friday. I may take it easy on the trading (I usually do on expirations), unless a nice short opportunity presents itself.

I hope this helps. Good luck with your trading.

Wednesday, April 15, 2009

Market overview for April 15

We started the day on a negative bias for the index futures as a result of the Intel (INTC) earnings and some negative economic news regarding consumer price index.  Shares of INTC were under a lot of pressure despite the strong earnings and revenue report, which in turn led to strong weakness in Nasdaq and Semis.

However, it did not take long for the buyers to show up and as has been the case recently, financials and real estate led the market higher.  AMR preannounced early during the session and its stock soared 25% in 10 minutes and lifting all airlines stocks.  Initial strength in railroads quickly faded though and these ended at the lows.

It was another see-saw whipsaw kind of day for sure.  My first trade of the day was a long in ERY as the crude inventory numbers came in. However, the weakness in that sector did not prevail and the trade was good for a 50c scalp on half the position, and stopped out on the rest. I had four signals on the ES chart today which is unusual.  I acted on 3 of these for scalps of 30c to 50c.  Ironically, my last signal was the best of the day, but I only took half a position and the market rallied very strongly into the close.

My list of short candidates grows longer by the day.  We are still overbought and have not had breather in a while.  I believe the SPY has not had more than 2 down days in a row since March 10 - very impressive.  Tomorrow JPM and GOOG release earnings, and C on Friday.  My opinion is that anything short of spectacular is going to be sold - as has been the case recently with INTC and GS.

We are getting close to a stochastic sell setup on the weekly but the pattern is in early stages of forming.  The SPY is currently sitting right at the 20 period MA of the Weekly chart.  Lots of resistance overhead.

In the meantime - stay alert and focused in your trading and stick to your plan.  Good luck.

Tuesday, April 14, 2009

So, WHY are you trading?

Ok, we all know why we first started to trade. Dreams of making it big in the market and retire early, buy that boat, pay off those loans, etc. But, after a while, reality sets in and you figure - this trading business is harder than I thought. You got THAT right!

I believe that answering this question is vital in succeeding as a trader. Why are you trading? The easy answer is to make money, right? Of course. But the real answer is not so easy. Here's why: If you are looking to just make money, then emotionally you are in a losing battle even before you put on your first trade. You are thinking about making money and immediately your trade is influenced by emotions of fear and greed.

Now, consider this. Most traders have the intention of making money through their trading activities although they do not know quite how this is going to come about. They do not work their 'tails' off day after day. They are looking for something easy. Often they lack a clear understanding of their motivation for trading.

On the other hand, consider that your goal for trading is not only to make money, but to be RIGHT. That is, you have a system, you have backtested it, and it provides you with a decent 60-70% success rate. Or, you have a knack for scouring through data reports, earnings history, etc. and you are convinced that your trade is based on sound analysis and homework. In short, you have worked you 'tail' off day after day, night after night. The reward is to be PROVEN that you are right and correct in your analysis. Then, and only then will the money come.

We had a debate about skill and luck on Twitter today. My argument was that luck eventually runs out, but skill ensures you last and make a living. I would add that it requires skill AND hard work to succeed in trading, and I strongly believe that through this hard work and skill refinement, you are definitely able to make your own luck in this business. Make sure you have clearly defined goals, risk tolerance, a trading plan and you are on your way.

As always, good luck with your trading and I hope to see you on Twitter.

Is the rally over? Market overview for April 14

Well, Goldman Sachs (GS) reported record earnings yesterday and the market sold off on the news - the stock was down almost $15 today. The economic news from this morning (PPI and retail sales) were not very good and provided the excuse needed for taking some profits in a very overbought market.

Ironically, my two signals for today were longs on the ES (SPY), taken via short in SDS. I was able to scalp 50c for half on the first trade, then stopped out at entry. I also shorted SDS when SPY failed to go below Thursday's low, and that was also good for 50c in a wacky last hour of trading. I also piggybacked on Todd Stottlemyre's call on BTU which was good for at least $1 - this is not something I usually do, but BTU used to be one of my favorite stocks last year and is one of the better coal plays. This happens to be one of the reasons I decided to end my boycott of StockTwits - lot's of good ideas that are generated during the day.

I am including a 60 minute chart of ES mini. It can be seen on the chart at around March 11, there was a bullish MA crossover of the 20MA and 50MA. This is usually a good indicator on market trend and is still intact. So, one really must be looking to buy on pullbacks, until proven otherwise. The hourly chart is showing a bullish stochastic buy (which is yet to trigger).

My good friend on Twitter, fortune8, has an interesting post on his blog, about this rally. Have we missed this rally? In hindsight, and if you are one to buy and hold for more than one day, then you have missed a big part of this rally. But one cannot give up just because the market has run without us. I believe the psychology of the market has changed for now, and everyone seems to be chasing strength and buying the pullbacks. Momentum and breakout trades seem to be working again, and all we can do as traders is trade what we see. It sure feels like it is easier to put on a long trade than short (quite the opposite of a few months ago).

And remember that for all the moves that have happened recently, we are still only back to where we were in early February. Have all our problems been fixed? Is the worst behind us? I have NO idea - and I cannot claim that I know. But I do know this - I will take ALL my buy and sell signals on an intraday basis, and now I am looking for pullbacks to start swing long trading again.

Good luck with your trading.

Monday, April 13, 2009

Couple days to reflect, and Market Overview for Apr 9 and 13

I hope everyone had a great weekend and spent a wonderful holiday with their families.

If you read my blog over the weekend, you'd know that I was a little miffed as to why anyone would retweet a link as their own, especially only a couple of minutes after the original tweet. But hey, perhaps it was a coincidence, an oversight or whatever. We are not here to cry over spilled milk. We are here to make money, share ideas, and most of all learn. I know I've learned a lot in the short time I've been on Twitter and met a lot of very smart and very friendly people. I believe I have some ideas to offer as well, and I hope to do just that with this blog and Twitter.

On Thursday, eSignal's data feed was down most of the day - I think it came up around 12:30pm. It was another difficult day to trade as we gapped up pretty big on the (surprisingly) strong earnings pre-announcement by WFC. The only signals I received from my system (which I could see after eSignal was online) occurred at around 10:45am for a countertrend move, and at around 12:00pm for a continuation of the trend. I did not take any trades, as by the time I was back online, I would have had to chase the entry point - something that is a no-no in my plan.

Today, I got 2 signals on ES (and SPY), the first one at around 10:15am. This was a tough signal to trade, as it would have required me place a wide stop on my position, so, I decided to take half a position. Also, it was a long signal, and I am being very careful with anything long right now. After a gut-wrenching move back down, the position started to move in my favor around noon and finally cracked the opening range highs for a continued move up. I ended up scalping 50c and 75c from my SDS short. My second signal was also a long in ES at around 3:15pm which I decided not to take.

GS announced earnings after hours and surprise - it was another record earnings. I guess the AIG short must have worked nicely for them. Stock was all over the place in AH, and I believe ended down a couple of points.

I have been doing some research on stocks for long and short positions, and my shortlist of longs is almost non-existent right now. And I think it is too early to short - I will need some confirmation before jumping in. We are coming into some stiff resistance on a lot of stocks, and the 200MA is lurking above for most stocks.

Good luck and stay patient.

Wednesday, April 8, 2009

Favoring the Short side if....and Market overview for April 7 and 8

It has been a very choppy week and very difficult to get a sense on the direction this market will take. It seems that 'all news' is out regarding banks, TARP, TALF, GM, bailouts, etc. The question is has all the 'bad' news been priced in?

With this impressive move the last four weeks, it definitely feels a lot like last Apr/May when the market got quickly ahead of itself and the rest is history. Earnings will be key, especially banks and financials. Already we are hearing about BAC requiring some odd $36B additional capital, and the results of the banks stress tests will not be released until after earnings - this can't be good. But the market seems to be taking these news in stride, so we'll see what happens.

Since I did not post yesterday, I wanted to include my signals for the last two days. Yesterday, my first trade was a short in SPY on the expectation we would continue the gap down. I was stopped out and eventually got a couple of signals after that which were good for good 50c - 70c scalps.

Today, I started the day with a short in SDS and a long in POT which reversed nicely after the earnings news by MOS and the trade was good for 50c and 70c scalps. It continued on to for at least $1-$2 additional gains - but I closed the trade when I got a signal to go short SPY. I had a couple of other signals which were good for 70c and $1 scalps on SDS.


Going forward, I am attaching a daily chart of SPY. I still feel we are in a critical trading range here which has not been resolved. I mentioned on twitter that I have a sell signal on SPY which will be triggered on a close below Tuesday's lows of 83.51. It also happens to be a break below the lower trend line shown on the chart. The last couple times I got this signal was around Feb 10, Jan 7 and Sep 3, 08, which marked the begining of a severe correction each time. Will the same thing happen? I don't know - but we will soon find out.

A break above 84 on the SPY invalidates this setup and it may mean that this rally is real and time to get on board for LONG positions.

Either way, we will be ready for what the market brings.

If I don't post tomorrow, have a great weekend, and good luck with your trading.

Monday, April 6, 2009

Market overview for April 6

It was a very choppy session today and we gapped down at the open. My first trade of the day was reversal from the Opening range highs with an SDS long and the trade was good for 60c and 50c on each half. I closed the position when I got a signal to go long the SPY which I took with an SDS short. In hindsight, I should have waited for the SPY to close above the VWAP, but I had a very tight stop in case it reversed - which it did.

After that, I got about four additional conflicting signals (long followed by short, etc.) on the SPY so I scalped a few trades here and there and decided to stop trading as I did not have a good feel for the direction.

On an average day, I'll get 2 or 3 signals using my TA indicators on a 15 minute chart. On days like today when I get several signals, it usually means I need to step aside until the market moves in a clear direction.

I attempted a low risk short in RIMM today as price stalled at R3 - the move was good for at least 50c but quickly reversed and I scratched the trade for BE. RIMM broke out today and the next stop is 67-68 and possibly 77-80.

I believe that earnings will determine the direction of the next move in this market. We have gone up too far too fast in the last 4 weeks, which means that earnings expectations are high. Investors will have their finger ready on the trigger to protect profits. The key is whether buyers will step up during pullbacks.

As usual, good luck with your trading and let the trades come to you!

Sunday, April 5, 2009

Market overview for April 3

Relatively quiet day on Friday and I was a little biased to the short side. My first trade of the day was a long in SRS as it was about to break the 60 minute opening range. With the big run-up in REITS this week (and consequent SRS meltdown) my stop was unusually tight with SRS - only 50c. Needless to say, I got stopped out on the false breakout. I actually attempted to short it but could not find any shares on IB.

My next trade was a signal setup on the ES (and SPY) at around 11:00AM which I took with a short in SDS. I booked profits at 50c .

I attempted another long at SRS and only scalped 35c out of the trade - which was real lucky as this thing just TANKED (and I mean TANKED) in the afternoon. Something must be up with REITs as they have been aggressively accumulated lately. We'll find out.

I had another signal long ES at around 2:00PM but did not take it as I just sat back and watched the market - did not want to end the week on a losing note.

I am not sure what to expect for the coming week and I am not finding that many stocks to go long or short right now. While I believe that we are due for a pullback, we may very well have put in a bottom and started a new leg up - only time will tell. Earnings season is coming up and lots of news will surely determine which way we go. As usual, I'll follow my signals and go with the flow.

Good luck!

Friday, April 3, 2009

Market overview for April 2

Today, once again, I had issues with eSignal application in the AM and late aftenoon just before the close. I missed the very first signal of the day (the first 15 minute bar). I had a bias towards shorting the market as we were gapping up right into resistance and last week's highs.

I attempted a low risk short trade (highlighted in the red arrow) as rejection of R1 in the SPY (and ES). However, I was stopped out for .50 loss on SDS long. I also attempted another short which also did not work and broke even on that one. It was time to step aside and look for entries to go long the market. My patience paid off as I got a signal to go long at around 1:15PM - so I shorted SDS, good for about .80 profit. I also scalped SKF long a couple of times but ended up with a scratch as the last hour was quite volatile - this is where one should stick to their plan! Financials were not very strong relative to the market, so it will be interesting how tomorrow plays out as the March unemployment numbers come out. We have again gone up too far too fast, so we'll see if the buyers will give this market a chance for a breather.

RIMM is on fire in the after hours and I almost took a trade long but did not pull the trigger. It was up over $10 in the late session. We'll see how it plays out tomorrow.

Good luck!

Thursday, April 2, 2009

Thoughts on trading.

Well, if you (or anyone you know) can figure out this market - kudos to you. I sure can't. When I first started trading, I could not figure out what kind of trader I wanted to be, a technical analyst relying on charts, a fundamental analyst, or both. It took me several months and trials and errors to 'find myself' in terms of trading.

First and foremost, like I have said before, getting in a trade is the easy part. Managing the trade is what makes or breaks a trader. I think about 90% of my losses early on were due to poor money management. Things like poor stop selection, moving my stop up too soon, scratching a trade if it does not make money right away before it hits my stop, etc. Some other common mistakes (which are killers in a bear market) include chasing strength (or weakness) and not properly adjusting risk during volatile periods.

It is so easy to stray from one's trading plan and it takes lots (and I mean lots) of discipline to be able to trade your plan consistently. A few months ago, I 'found' my niche - a set of indicators that I use that gives about 80% accurate signals on the S&P (and derivatives). It can be used for pretty much any stock, FOREX, future, etc. but I have found the most accurate results come on SPY (or ES emini). E.g. March produced about 30 good signals, and only 5 bad signals - that's pretty impressive.

Feb, Jan and Dec (08), were also impressive (around 70%-80%) success rate. My biggest problem has been to actually 'trust' this system. I have been watching, studying, tweaking this system for the last few months to get it to the point where I can just sit back and wait for the signals to occur.

I have had to un-learn a lot of bad habits and break free from the 'market should do this or that' tendency that has proven to not work for me. Some people are pretty good at it who have been doing this for many many years. But, it has not worked consistently for me - besides, I have a big ego and and I would rather not have to find out the hard way that I am wrong. It takes courage (not to mention a few losses) to be able to realize your weaknesses and rectify your trading accordingly to ensure success in the long run.

Someone on Twitter (sorry, I forget who) mentioned that a good trade is like a good swing in golf - you know the moment you place the trade (like golf - you know the moment your club hits the ball) that it is a good trade. As a golfer, AND as a trader, I know exactly how that feels. Most of my trades that I take within my trading system 'feel' good. I know that probability is on my side and I accept the risk. I am less stressed and don't feel too bad if it loses money. However, when I take trades outside of my plan (like chasing strength, or news related trades), I find myself being stressed, outside of my comfort zone, and eager to just end the trade.

My point is this, if you or anyone has traded, or attempted to trade the market the last hour recently knows that you might as well play roulette. If however, you have a 'system' that consistently produces good signals, then sit and wait for your signals and don't force any trades. Let the trades come to you, and make sure you are trading your plan. It is something that I am still struggling with occasionally, but am learning to overcome.

As for me, I have come to the conclusion that I am most effective when I rely purely on TA for my trading - purely chart action. My 'hunches' are sometimes good. But they are also sometimes bad. There is no reason not to trust what I have and maybe eventually rely on my hunches after several years experience and a fat trading account that can absorb hits that do not bruise my ego. For now, I am building a repertoire of ways to look for low risk trade entries in addition to my TA system, such as chart patterns, bounce plays from trend lines and/or support/resistance, opening range breakouts/breakdowns, etc.

In the meantime, good luck and don't forget to stick to your trading plan! If you don't have a plan - STOP IMMEDIATELY! Go and write your plan on a piece of paper (a napkin if you have to).

Wednesday, April 1, 2009

Market overview for April 1 - Roller coaster ride...

Today was a wild ride in the market. We started the day with yet another gap - this time down big, after the ADP unemployment numbers came out this morning. However, after the 10:00AM numbers came out, buyers came out with vengeance. The market recovered all its losses and quickly closed the gap and ended the day up 150 points - that's a swing of over 300 points from low to high. Of course, we had the last hour shenanigans messing with traders as well. It looked like we might reverse and go lower, but buyers emerged yet again in the final 30 minutes to push us into the highs of the day.

I had some issues today! Everytime there is a surge in volume in the market, my eSignal application freezes up! This has occurred frequently and only happens during high volume periods (like yesterday afternoon, this morning, and every time there is some news event - e.g. Fed announcements). It is driving me crazy and support has not been able to fix. So, having said this, I missed my first (and most important) signal of the day at around 10:15AM. By the time I saw it (after I re-booted my PC), the market had continued its move and I did not feel confident with the entry. Luckily, I was able to go short SDS at around 11:15 after the SPY bounced from the daily pivot - managed to squeeze about .70c from the trade. My second signal was counter-trend - but I took it anyway around 1:00PM and got stopped out on the SDS long. But immediately after, I got a long signal in the SPY and took a short in SDS. That was good for 70c and I was able to recoup my losses from the earlier call.


I also took some trades in SRS long (REITS were underperforming) and short, and POT short (twice - I was stopped out on the first and got the second one to work). My missed trades of the day were RIMM (which I highlighted on Twitter) where it was positive right from the get go in a bad down market, and APOL. Yes, the same APOL I have been blogging about all week!!! My short entry point was below 75, but it gapped way below that around 72 and I decided NOT to take the short! (You may insert expletive here _____ )! I'd like to know if anyone took the trade - which was good for oh about $8 from the open! This is a multi-day move in my opinion, so I'll look to short in the coming days.

I think it's going to be wild again in the coming sessions with unemployment numbers tomorrow and Friday, lots of headline news risk, and earnings season coming up.

Good luck and don't forget to stick to your trading plan!

Tuesday, March 31, 2009

Market overview for March 31

The market gapped up this morning on no particular news. Financials were strong again and led the gains in the market along with big cap techs. My feeling today was that there would be some profit taking as it is the end of quarter and it felt like institutions might lock in some recent profits in an otherwise horrible quarter. So, I had a bias towards shorting the market but was waiting for confirmation all day.

My first trade of the day was indeed a Long in SDS at around 10:45 after the first reversal from the very important psych 800 level on the SPX. The trade was good for .50c where I sold half. The other half was stopped out at entry.

The market was choppy and meandered most of the morning and early afternoon in a very tight range around that 800 level in SPX. However, after getting a signal to go long just before the 800 level was to be tested for the 5th time, I decided NOT to take the signal thinking it would reverse again. Bad mistake, as the market surged past this level and SDS would have been good for at least a 2.00 gain.

As usual, the final hour provide some fireworks again. The market lost most of its gains in the final 30 minutes of trading on heavy volume. I was able to go long SRS which was good for 1.20. I was also long ERY before the selloff started, but was not patient with the trade and sold it for B/E. I also took a short in POT as it did not participate much in the rally and had come in just prior to the selloff. that was sold for a 50c gain.

Tomorrow, I am expecting the selloff to continue, but as usual, I will wait for the setups and confirmation in the charts before committing.

Update on APOL: earnings are out this evening and although they beat estimates, the market reaction is not good and the stock is down post-market. This might setup as a short on a move below 75.

Good luck!

Monday, March 30, 2009

Market overview for March 30

Futures we horrible this morning following GM's news and we gapped down pretty big. President Obama was scheduled to make a speech at around 11:00AM, so it was a choppy morning to trade.

My first signal to short the market was around 10:15 when the SPY was rejected at the VWAP. Instead of trading SDS Long like I normally do, I decided to go with a long in SRS. I was a little early on the call and was stopped out for .50c (I think my stop was too tight and something I need to rectify).

My next signal was around 1:00PM, again to short the SPY. I did not take the signal and was willing to sit on the sidelines as the market was holding support at the 780 level on SPX.

I think we are at an important juncture for the market this week. SPY is holding the 200MA on the 60Min Chart (with a Stochastic Buy setting up) and if we hold 76-77, especially on lower volume, then I think the chances are pretty good we move back up next week. We'll see how the market unfolds and I hope to be ready take advantage. Other than my daily signals, I'll post what signals I get for a short term (multi-day) move for the SPY on Twitter.

All the stocks I highlighted over the weekend gapped down (as did almost all stocks today) and continued moving down most of the day.

Good luck!

Sunday, March 29, 2009

How I use earnings in my trading, and a look at MON and RIMM

Someone said that the we have had the "largest three-week move in stocks since 1938". Wow - that's quite amazing. Does this signal the all-clear? I don't know, but I sure hope so. I would much rather go long than short, but I'll take my setups either way.

With earnings season coming up, I wanted to share some of my thoughts on how I use earnings along with chart setups to build a watchlist of stocks to trade. I am not a big fan of holding stocks into earnings announcements. Even though that's how I made most of my $$ a few years ago - anyone who remembers Forward Industries (FORD) and Dynamic Materials (BOOM) knows what I am talking about. I remember riding these for 200% and 300% gains (among others) - aaah, the good old days!

But knowing HOW to trade a stock prior and post earnings takes out the 'unknown' factor and gives you a much better advantage to trade. In general, I usually look at 'whisper' numbers for a stock that interest me at a site like EarningsWhispers.com about a week or so prior to earnings. Knowing if a stock is overbought or oversold prior to earnings, combined with analyzing the whisper number and then finally when the earnings result comes out, gives a trader many ways to trade a stock prior and post earnings. For example, if a stock is overbought into earnings, the whisper is below consensus, and the earnings are not good - definitely a very strong candidate to short after earnings.

Keeping in mind that we are in one of the worst bear markets ever, momentum type trades are almost non-existent (some exceptions include AMZN and NFLX). So I would definitely NOT be chasing any strength in this market (yet).

Looking at MON and RIMM, both are reporting earnings next Thursday. Like many stocks, both are over-extended in the short-term.

MON is sitting right around resistance at 87-88, with the 200MA lurking above around 90-91. I believe it is too late to go long here, and the stock is definitely primed for a pullack. I am expecting good results from MON and I believe a close above the resistance levels would push this stock back towards 100.


RIMM gave a warning back in February, and after an unbelievable run in January, dropped like a rock. So, even though the bad numbers might already 'baked' in, the stock is still overbought going into earnings and looks ready for a pullback. It is late to go long here, however, if the stock pulls back to around 40, holds and then cracks 46-47 again after earnings, then look for the gap in early Feb to be closed with a move back to 60.

Update on APOL - will be releasing earnings on Tuesday (thanks Crazycolo1).

Good luck!

Saturday, March 28, 2009

Building a watchlist of potential shorts? Some ideas...

There is a plethora (I love that word) of stocks showing up as possible short candidates for next week. First off, many financial stocks are a) overbought and b) showing tight consolidation patterns over the last few sessions. A look at XLF shows that a move towards the lows of this week will most probably invite a wave of profit taking and a resurgence of wounded (or hibernating) bears. However, a break of the highs around 9.70-10 and this rally may have some legs. Potential names with weaker charts include BAC, C, AXP and WFC.

Steels and some weaker energy names also look vulnerable here as well. STLD, X and CLF are sitting right along the 50 day MA (like soooo many other names as well), not to mention right at the 38% Fib retracement level. Other energy names include D, COP and GMXR.

APOL setup discussed earlier is looking ready to setup for a short below 75.

Good luck.


Have we bottomed? Does it really matter?

When I first started day trading, I used to let my 'swing trading' instincts guide the way I treated the market on a day to day basis. That thinking left me vulnerable to missing out on some huge moves during this past year. Why? Simple: Markets tend to go much lower or higher that one might think. Especially in a bear market! The science (or art :-)) of picking a bottom is simply a waste of time in my opinion. One can try justify the (many) reasons for the call - whether it is technical analysis, fundamental, astronomical or whatever, one simply does NOT know what will happen tomorrow or next week. I would much rather let the market play itself out and show its hand BEFORE I react. So, my preference is to react and NOT to anticipate.

If one is an investor, or a swing trader, then in my opinion, it is more important to know that the bottom (MAY) have happened (like we have now) and use it to make their trading decisions. In other words, I would prefer to get CONFIRMATION of the move instead of guessing when it will happen.

Which brings me to the other point - as a day trader, it should not matter whether or not a bottom (or top) is in. It may give you bias as to the direction you want to go in, but should NOT determine your trades. A day trader needs to be nimble enough to adapt to market conditions that change very quickly during the day and trade based on setups, news, whatever, to gain an edge. If you have a set of criteria (such as MA crossover, MACD, Stochastics, whatever) that you use effectively, and you get a sell signal in a down market - a day trader should not be afraid to take the signal just because the market is "down too much already" and will surely turn soon. The key is to KNOW your criteria for taking a trade, such as support/resistance zones, profit target, and most importantly, a logical place to put your stop (i.e. your risk).

So, come Monday morning, everyone and their brother is expecting some kind of pullback in the market (myself included). But if we don't go down, and go up instead - then you follow the trend (until you are proven wrong).

Good luck with your trading.